
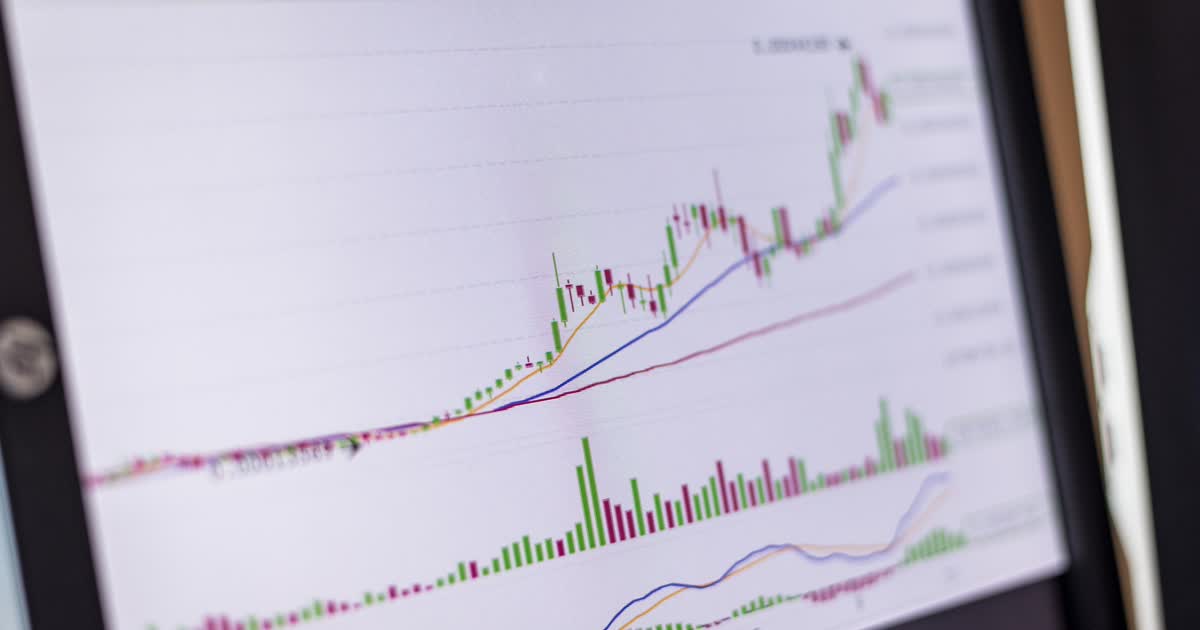
Bitcoin is trading above $80,000 today — and jumped there sharply today specifically, up more than 5% in a single day. That's a real, current price, not a projection or a target, and it caps a run of roughly 28% over the past month. I've made six real calls on this chart since February. Not vague "crypto is the future" takes — specific prices, specific reasoning, written down before I knew how they'd turn out. It's easy to only remember the ones you got right. So let's grade all of them, in order, including the ones that aged badly.
Standard disclaimer before we start: I'm not a financial advisor, this isn't financial advice, and everything below is my own read of a public chart. Do your own research, and never risk money you can't afford to lose.
Call #1 — February 5: "This Is One of the Best Buying Opportunities in Years"
Bitcoin had fallen about 48% from its October 2025 peak of $126,198, sitting around $64,000, with the internet convinced it was headed to $38,000 or lower. My call: this was macro-driven fear (tariff disputes, ETF outflows, tighter Fed policy), not a crypto-specific breakdown, and history said crashes like this get bought.
The grade: directionally right, badly timed. $64,000 was not the bottom — not close. Bitcoin kept falling for another five months, eventually bottoming around $58,000 as June turned to July. Anyone who went all-in on February 5 sat on a paper loss for nearly half a year. But I framed this as accumulation, not a single bottom-tick call — and dollar-cost-averaging from $64K down through the eventual low, into today's $80K+, is comfortably profitable. The thesis held. The timing didn't.
Call #2 — March 5: "Is This the Final Dip?"
A month after the first post, Bitcoin had bounced to $73,000, then rolled back over to around $70,000, five red months into the cycle, weekly RSI at 27 — a level historically only seen near major bottoms. I called it a possible final dip and said I was still buying.
The grade: wrong on timing, again. This was not the final dip — Bitcoin fell another 15%+ from here before actually bottoming in June. Two calls in a row for "this might be the bottom" that weren't the bottom is a real miss, and I'm not going to dress that up. What I'll say in my defense: the underlying pattern I pointed to (each crash cycle getting less severe — 84%, then 77%, then this one's ~48%) was correct, and continued accumulation through this period still worked out.
Call #3 — June 2: "More Liquidation Is Coming, But No Dramatic New Lows"
Bitcoin had broken below $70,000, trading around $67,700, after $1.2 billion in leveraged positions got liquidated in a single day. My call: expect more pain, but not a dramatically lower low.
The grade: mostly right. There was more liquidation, and there was a lower low — Bitcoin fell further to just under $60,000 by late June. That's about 12% below the June 2 price, which is real but isn't "dramatic" in the way a fresh 40%+ leg down would have been. Reasonable call, held up.
Call #4 — June 29: "Is Bitcoin Forming a Bottom?"
Bitcoin had fallen into the $59,000s and broken below its 200-week moving average — historically where major bottoms form — with weekly RSI showing bullish divergence (price making a lower low while the momentum indicator didn't). I called this a real bottom-forming signal, while being honest that it wasn't a guarantee.
The grade: this was the actual bottom of the year. Bitcoin never traded meaningfully below the $59,000s again after this post. If you were going to point to one moment all year and say "that's where the real reversal started," this is it.
Call #5 — August 11: "One Final Test Near $61K"
Working from a short-term ABC corrective pattern on the chart, I called for a final test down toward $61,250 (a 1.618 Fibonacci extension) before the next leg up, with Bitcoin trading around $64,700 at the time.
The grade: nailed it. Bitcoin bottomed at $62,470 on August 14 — three days later, off my $61,000 call by just $1,470, about 2%. That's about as close as chart-reading gets to being right.
Call #6 — August 21: Grading the $61K Call, and Watching It Run
I wrote up the August 11 grade the same week Bitcoin kept climbing — from the $62,470 low through $69,000, $71,000, $72,000, and $73,000 on a record $2.7 billion short squeeze. By the end of that same day, it had pushed further to $76,700, then $78,000, then $79,000, on real catalysts: a confirmed September 9 Treasury buyback start date, a White House crypto meeting, and mounting pressure around the CLARITY Act.
The grade: correct, and the follow-through kept going. Bitcoin has now cleared $80,000 — past even the $79K level I was tracking two weeks ago. August closed with roughly 28% monthly gains and $3.5 billion in spot Bitcoin ETF inflows, the strongest single month in over a year.
Where Things Actually Stand Today
Checking this live against CoinMarketCap and TradingView rather than going off yesterday's number: Bitcoin is trading at $81,183 as of this evening (per TradingView's Bitstamp feed, 7:47pm Eastern), with CoinMarketCap's broader exchange average showing the same picture, right around $81,300. That's up more than 5% today alone — a real single-day jump, not a slow drift. Yesterday closed at $77,302.
The trigger is dated and specific, not vibes: Fed Governor Christopher Waller signaled support for holding interest rates steady if inflation data keeps improving, which pulled the market's odds of a September rate hike down from 63% to around 50%. Lower rate-hike odds are good news for risk assets generally, Bitcoin included. That move got amplified by a real short squeeze on top of it — over $415 million in bearish Bitcoin positions got liquidated in 24 hours, with $164 million of that in a single four-hour stretch, forcing traders who bet against the move to buy back in and pushing the price higher still.
The next scheduled catalyst on the calendar is the Senate's procedural vote on the CLARITY Act, now scheduled for September 15 — the bill that would finally draw a clear regulatory line between what counts as a security (SEC's job) and what counts as a digital commodity (CFTC's job). I'll give you the honest version instead of the hopeful one: prediction-market odds of the bill actually passing have fallen hard, from around 58% down to under 20%, as lawmakers stall on government ethics provisions, law enforcement language, and stablecoin yield rules. This was supposed to be a clean bullish catalyst. It's turning into a real coin-flip, maybe worse.
What I'm Watching Into Q4
Two real, dated events sit on the calendar right now, and I'd rather give you both honestly than pretend only the bullish one exists.
September 9 — the Treasury buyback starts
This is the catalyst that helped drive the run from $73K to $79K back on August 21, and it's now a confirmed start date rather than a rumor. What it actually does is inject liquidity into the system more broadly — it's not crypto-specific, but risk assets including Bitcoin have historically responded well to this kind of liquidity event. Worth watching whether the market has already priced this in ahead of time, which is common, or whether there's a fresh reaction on the actual date.
September 15 — the CLARITY Act vote
This is the one I want to be careful not to oversell. The CLARITY Act would finally give crypto a clear regulatory line — what counts as a security under the SEC, what counts as a digital commodity under the CFTC. Back in early August, prediction markets had this passing at around 58% odds. As of this week, those odds have fallen under 20%, as lawmakers stall out on government ethics provisions, law enforcement language, and stablecoin yield and rewards rules. If it fails or gets delayed again, don't be surprised by a short-term negative reaction — not because the fundamentals changed, but because a chunk of the recent optimism was priced in around this exact date. If it somehow passes despite the fading odds, that's a genuine surprise catalyst to the upside.
The Scorecard
- Feb 5 — Right thesis, five months early. B-
- Mar 5 — Wrong on "final dip," pattern read was still correct. C+
- Jun 2 — Reasonably accurate on both counts. B+
- Jun 29 — The actual bottom of the year. A
- Aug 11 — Off by 2%, three days early. A
- Aug 21 — Correctly rode the breakout, called it straight. A
Two early misses on timing, four calls in a row that landed once real technical signals (200-week MA, RSI divergence, Fibonacci extensions) replaced pure "this feels like fear" reasoning. That's not a coincidence — it's the difference between calling a bottom because a crash feels overdone, and calling one because a specific level lines up with several independent signals at once. The February and March calls were both built almost entirely on sentiment and historical drawdown comparisons — real data, but the kind that tells you a bottom is somewhere nearby, not exactly where. The June 29 call onward leaned on the 200-week moving average and RSI divergence, and the August 11 call added a specific Fibonacci level on top of that. More signals stacking in the same place, not just a stronger feeling. Lesson taken, for whatever it's worth going into the next cycle.
What I haven't changed through any of this: no leverage, dollar-cost-average rather than trying to time a single entry, and never put in money I couldn't afford to be wrong about. That discipline is the only reason a 5-month-early call and a 3-day-early call both ended up fine.