
Three weeks ago I graded my own June bottom call and said the recovery to $64,700 had held up, but the altcoin rotation I was watching for was still unconfirmed. It's August 11 now, and altseason still isn't today's topic — because a smaller, faster pattern has formed right in front of it over the last week and a half, and it deserves more attention than the big multi-month cycle question I usually default to in this series.
Quick grade first, because I said I'd keep doing this: on July 20, Bitcoin was at $64,700, comfortably back above its 200-week moving average. It mostly held that level through late July, then broke down harder than expected in early August. This morning it opened at $63,912 and has traded mostly in the low-$64,000s, unable to reclaim last week's highs. That drop-recover-drop shape isn't random noise — it's a clean three-wave ABC correction playing out on the daily chart, and it's pointing at a specific number: $61,000.
The Short-Term ABC Taking Shape Since August 2
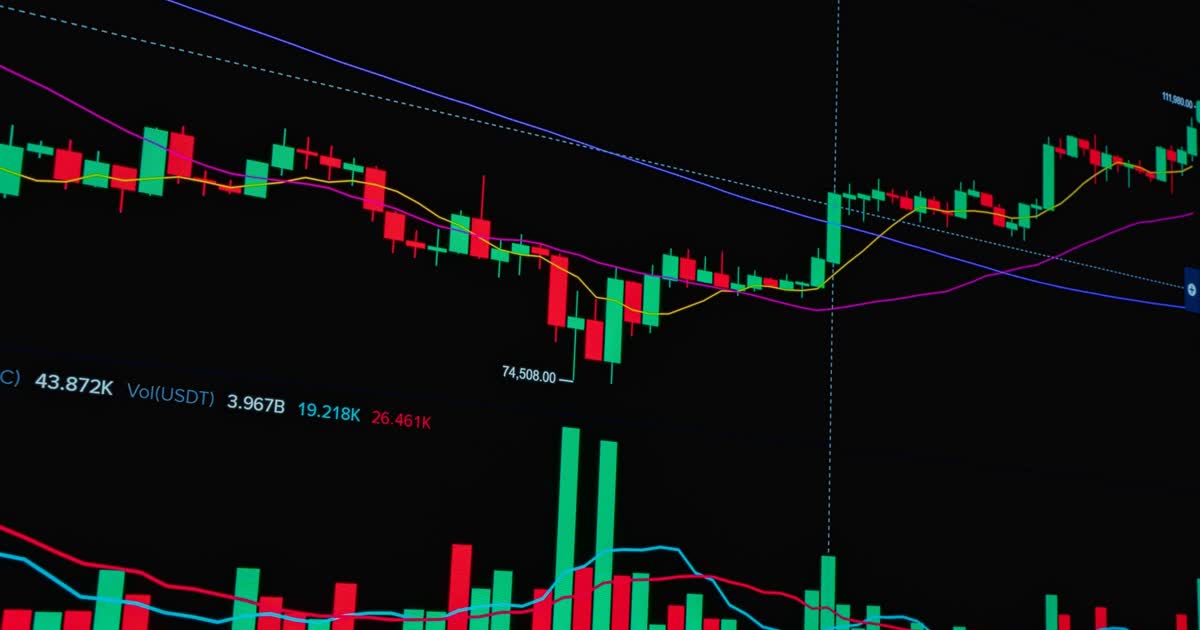
Zoom into just the last two weeks and a textbook ABC correction shows up on the daily chart:
- Wave A (Aug 2–5): Bitcoin rolled over from July's close near $64,700 and slid into the $62,200–$62,600 zone by mid-week — a move triggered by the Fed holding rates steady instead of delivering the cut some were positioned for, plus news that the crypto exchange BitMart was shutting down after nine years in business.
- Wave B (Aug 5–9): price recovered almost the entire drop, climbing back through $64,000, first breaching $65,000 on August 7 (a local peak of $65,340), then holding above it again into August 9–10 — a real, multi-day reclaim, not a one-candle wick.
- Wave C (Aug 10–now): the reversal. Bitcoin rolled over on the 10th the same day Strategy disclosed selling 1,690 BTC ($109 million), then took a second hit today, August 11, when hopes for a U.S.–Iran deal to reopen the Strait of Hormuz fell apart — Bitcoin is down roughly 1.7% over 24 hours, briefly dipping under $64,000, and remains pinned below $65,000 as of this writing. That's the leg currently in progress.
Run the actual math and two different technical targets fall out of it. A simple 1:1 move — Wave C matching Wave A's roughly $2,500 decline — projects to about $62,800 measured down from Wave B's $65,340 high, which lines up closely with the $62,662 support level chart services are already flagging today. A deeper 1.618 extension of Wave A — the standard next Fibonacci ratio when a corrective wave is expected to meaningfully undercut the prior low rather than just match it — projects to about $61,250. Both are real, calculable levels, not numbers I picked because they sounded round. And the deeper of the two lands almost exactly where the bigger picture already has independent reasons to care.
Worth noting what’s actually driving each leg, because a pattern backed by real news flow is worth more than one that’s purely technical. Wave A wasn’t a random air pocket — it came with an actual catalyst (a more hawkish-than-hoped Fed decision plus a real exchange shutting down), which is the kind of thing that produces a genuine capitulation candle rather than a mechanical wiggle. Wave B’s reclaim of $65,000 was gradual across several days and two separate attempts (Aug 7, then again Aug 9–10) rather than a single violent short squeeze, which typically means real buying rather than short covering. And Wave C has now lined up with two separate pieces of news — Strategy trimming its position on the 10th, then the Hormuz deal collapsing on the 11th — rather than starting or continuing for no visible reason. Each leg has a story behind it, not just a shape on a chart, and that matters more to me than the pattern alone.
Why $61,000 Specifically
A nine-day swing pattern on its own wouldn't be worth a full post. What makes this one interesting is that its projected target lands almost exactly on top of the level the bigger picture has been defending since June:
- The confirmed cycle low so far printed at $60,861 on June 7 — essentially the same zone this micro ABC projects toward.
- The 200-week moving average, sitting around $63,700 in early August, is the same line that's marked every major cycle bottom since 2015. Bitcoin has spent the past several weeks chopping on both sides of it, and Michael Saylor's Strategy is now publicly tracking this exact line against its own holdings.
- On-chain signals from earlier this summer — the monthly RSI hitting its second-lowest reading in 17 years, and a real miner-capitulation event — both showed up in the same $60K–$61K window, and both have appeared at the bottom of every prior cycle (2015, 2019, 2022) without exception.
A short-term chart pattern lining up with a multi-year moving average and on-chain floor signals is the kind of overlap that actually changes my thinking. Any one of those on its own is a data point. All three converging on the same handful of dollars is confluence.
The Case Against — Short-Term Bulls Have an Argument Too
I'd be cherry-picking if I only showed you the drop-to-$61K case. As of this morning, the live technical picture is genuinely two-sided: Bitcoin is described as approaching support near $63,000, with a failure to hold $63,898 flagged as the trigger for a slide toward $62,662 — one step, not a straight line to $61K. Some chart services also have an inverse head-and-shoulders pattern forming on the same timeframe, where a decisive break above resistance near $66,249 on rising volume would point to a move higher instead of lower. The 7-day range being priced in by trackers right now is roughly $62,662 to $67,025 — wide enough that both my ABC-down read and a bullish breakout are still live possibilities.
An inverse head-and-shoulders pattern, if it is real, would read the early-August low as the "head" and expect a shallower right shoulder rather than a new low — which is a genuinely different story than the ABC count above, where that same low is Wave A and a fresh, deeper low is still coming. Both patterns can’t be right. That’s exactly why I’m not treating this as settled and why the confirmation levels below matter more than either label. In plain terms: the bear case says Wave C isn't finished and grinds down to $61K. The bull case says $62,662–$63,900 holds as support and Bitcoin instead breaks out through $66,249. Both are sitting on the chart right now. Anyone telling you which one wins with certainty is guessing same as I am.
One more thing worth flagging: volume on this whole nine-day move has been described as moderate, not heavy, on both the drop and the recovery. That matters because a low-volume pattern is more prone to getting invalidated by a single piece of fresh news than a high-volume one is — the kind of move that happens on light trading can reverse just as easily as it started. I would put more weight on this ABC read if the next leg, whichever direction it goes, comes with volume that actually confirms it rather than another quiet grind.
What Would Actually Confirm This, Either Way
Same as always — a checklist beats a prediction dressed up as one:
- A daily close below $62,662 would confirm Wave C is extending and put the $61,000 target squarely back in play.
- A daily close and hold above $65,000–$66,249 — clearing the inverse head-and-shoulders neckline — would say the correction already ended on August 2 and this whole ABC read is invalidated.
- Continued chop between $63,900 and $65,000 — which is close to where price has spent today — doesn't confirm either case. It just means the market hasn't picked a direction yet.
- Watch whether $61,000 gets tested and immediately reclaimed (bullish — matches the June 7 bottoming behavior) or gets closed below on real volume (bearish — opens the door to the deeper $50K–$55K zone some analysts have flagged for the broader cycle).
My Take
The honest read on August 11: this is a short-term swing pattern, not a multi-month cycle call, and I want to be clear about that distinction — I'm not saying the bear market bottoms this week, I'm saying the next few trading days have a specific, testable level to watch. I'd lean toward Wave C completing near $61,000 rather than the inverse head-and-shoulders breaking out first, mostly because $61K has so much unrelated support stacked underneath it from the bigger picture. But this pattern is only about a week and a half old, and short-term counts like this get invalidated far more often than the big multi-month ones do. I was too early calling bottoms twice already this cycle on the larger timeframe — I'm not about to pretend a nine-day chart makes me any more precise.
What I'm actually doing hasn't changed: still dollar-cost averaging on a fixed schedule, still unleveraged. If $62,662 breaks and this grinds down toward $61K, I'd treat it as a better entry inside a zone I already believe in, not a reason to panic. If $66,249 breaks first instead, I'm not going to be upset about being wrong on the short-term shape while still being positioned for the thing I actually care about. Last buying opportunity or not, the number worth watching this week is $61,000 — everything else on this chart is noise until price actually gets there.
Disclaimer: This post reflects my personal opinions and is not financial advice. Always do your own research and consult a financial advisor before making investment decisions. Cryptocurrency is extremely volatile and you can lose money.